
Disclosure: Fresh Life Advice may receive commissions for affiliate links included in this stocks article. However, we only include links to products that we believe in and utilize ourselves. These recommendations are not given out lightly.
The Main Rules of Fresh Life Advice Stock Investing Strategy
Of all the articles published in this blog’s archives, you can really boil down my incoherent ramblings into a few fundamentals that anyone can use to become a wealthy investor:
- Save more than you spend. Live below your means to be able to invest as much money as possible and as early as possible.
- Choose passively managed index funds or ETF’s (i.e. NYSEARCA: VTI or MUTF: VTSAX) with the lowest expense ratios (less than 0.15%) in lieu of picking individual stocks, mutual funds with high fees, or actively managed hedge funds.
- No short-term active trading. Yes, I’m even talking about the GameStop Stock Frenzy.
- Buy and hold for as long as possible, preferably forever. The longer you remain invested, the less “rigged” the market is.
- Pick a portfolio allocation and stick to it. Asset allocation trumps stock-picking and a constant search for alpha.
With all that being said, sometimes I will occasionally indulge my animalistic instincts and make speculative plays. In these cases, I am essentially betting on a certain equity (stock) to outperform the market.
But it’s important to realize individual stock investing should not be the majority of your portfolio. We are talking less than 20% of your net worth. Think of it as fun money. If you theoretically lost it all, you would not be devastated.
I know, even losing more than a penny, can be devastating to one’s fragile ego.
INVESTING IN INDIVIDUAL STOCKS
Investing in individual stocks and equities can be overwhelming. There are so many options to choose from. How do you know which will perform well?
The truth is… No one knows.
No one can confidently predict the future without knowing. That’s why investing in low cost index funds is such a trusted solution.
In general, the index funds track the overall market performance. Since indexes like the Standard & Poor’s 500 (S&P 500) are composed of 500 large public stocks, they can capture the stocks that do incredibly well. However, they also contain stocks that possibly underperform or file for bankruptcy.
The world usually references the S&P 500 or the Dow Jones Industrial Average as two major indexes that capture the stock market. They are two different indexes, but both are composed of some of the major companies that drive the market.

Although there is no way to tell what the future holds, studying the general market structure and where we are in the current market cycle can help provide a framework for better decision making and future market expectations.
The chart below shows the historical performance of the S&P 500 Index throughout the U.S. Bull and Bear Markets from 1926 all the way up to 2019. It’s imperative to remember past performance is no guarantee of future results. Nevertheless, looking at the history of the market’s expansions and recessions does help to gain a ‘Fresh Life Advice’ perspective on the benefits of investing for the long haul.

On the other hand, the Dow Jones Industrial Average (DJIA) is comprised of 30 large public companies. In the financial industry, the DJIA is used as a benchmark for the largest stock market in the world.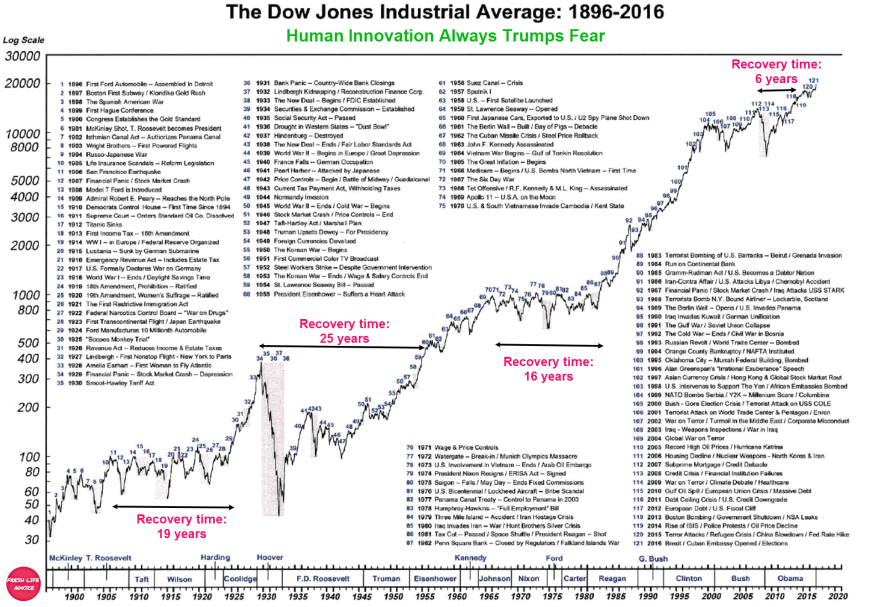
What can you observe from looking at the charts above?
Have a child look at this, and even they will be able to tell you the line goes up over time.
Investing, otherwise known as buying and holding, is not the same as gambling. If you invest in the market long enough, your investment will increase! Great news for investors!
Due to the former factors, the rate of return for index funds is much more stable than for individual stocks. In other words, the increases and decreases may not be as significant as other equities. This is also what’s known in the finance world as lower volatility.
Stocks are a risky investment vehicle – don’t get me wrong. But index funds are so diversified that it’s nearly impossible for you to lose your entire investment since the fund is unlikely to crash 100% when so many different companies are held in the fund portfolio.
However, as we’ve seen in the past (Covid-19 Correction of March 2020, Financial Crisis of 2008-2009, Dot-Com Bubble of 2000, etc.), investing in individual companies that do go bankrupt can lead to you lose all of your equity in that respective company.
Just remember:
“The markets can stay irrational longer than we can stay solvent…”
– John Maynard Keynes, Economist
Essentially, just because you made the right fundamental investment doesn’t mean the market will treat you fairly. It’s an “Eat-or-be-eaten” world. And the market can easily strip you of all your hard-earned money if you aren’t careful with your risk.
I’m a firm believer that you should never invest in anything that causes you to lose sleep. Dale Carnegie mentions in his famous best-selling book How to Stop Worrying and Start Living.
Without further ado, the two main approaches to use for investing in individual stocks are fundamental analysis and technical analysis.
FUNDAMENTAL ANALYSIS
Fundamental analysis measures stocks by looking at their intrinsic value. For this theory, companies are worth the net present value of their cash flows. Long-term investors study everything from the overall economy and industry conditions to the financial strength and management of individual companies. Earnings, expenses, assets, and liabilities all come under scrutiny by fundamental analysts.
Let’s run through 3 main aspects of fundamentals to check before investing in a stock.
1. Quarterly Earnings
Quarterly earnings are arguably the most important quality of a good stock.
If the company is consistently making money, you will be consistently making money too!
People always like to advise “Let your winners win”. I interpret this as the classic buy and never sell model that Warren Buffett’s mentor, Benjamin Graham, preaches in his book The Intelligent Investor. The underlying basis of this novel is fundamental analysis.
Companies that flaunt consistent earnings beat will see a steady increase in price. This is a major indication that the company is doing something right.
Here is an example of what Apple’s quarterly earnings looks like.
2. Company Leadership
Many investment gurus also claim that past performance does not indicate future results. There is no denying this, but instincts tell us this isn’t painting the whole picture.
Warren Buffett bought more than $1 billion of Coca-Cola (KO) shares in 1988, an amount equivalent to 6.2% of the company, making it the largest position in his portfolio at the time. It remains one of Berkshire Hathaway’s biggest holdings today. Coca-Cola’s iconic name and global reach created a moat around its core soft drink product, so Buffett did not have to worry a competitor would come and take away its market share.
There was a profound perspective Warren touted: no matter who was the CEO of Coca-Cola, the company would still thrive due to the economic powerhouse it had become.
For 99% of the other companies, leadership matters. If a company doesn’t have a strong C-Suite or Board of Directors, the company’s profits may suffer too.
3. PE Ratio
Price-to-Earnings (P/E) Ratio: A ratio used for valuing companies and to find out whether they are overvalued or undervalued.

A high Price-Earnings ratio indicates that investors are expecting higher growth of company’s earnings in the future compared to companies with a lower Price-Earnings ratio.
A low Price-Earnings ratio may indicate either that a company may currently be undervalued or that the company is doing exceptionally well relative to its past trends.
When a company has no earnings or is posting losses, in both cases P/E will be expressed as “N/A.” Though it is possible to calculate a negative P/E, this is not the common convention.
In general, if you see this P/E ratio higher than 30, the stock is likely overvalued unless there is significant future growth planned.
Jeremy J. Siegel’s The Future for Investors: Why the Tried and the True Triumph Over the Bold and the New is a great resource for all kinds of investors interested in fundamental analysis.
Siegel is the Russell E. Palmer Professor of Finance at the Wharton School of the University of Pennsylvania. He discusses extensively on the economy and financial markets.
PE Ratio in Action
In his novel, Siegel argues that P/E ratio matters. He compares all kinds of stocks. For example, he asks you if you’d rather invest in Standard Oil of NJ or IBM from 1950 to 2003. What do you think?
Initial instinct tells you IBM because of the technological revolution. As a result, IBM did well because investors expected it to do well.
The basic principle of return states that the long-term return on a stock depends not on the actual growth of its earnings but on how those earnings compare to what investors expected.
The results? Standard Oil of NJ beat out IBM by a narrow margin of a 14.42% return vs a 13.83% return.
Although the difference seems small, when you look at equal initial investments of $1,000 in each company, the outcome is astounding!
After 53 years, the small investment in the oil giant yields $1,260,000 while IBM yields $961,000. That’s 24% less…

Who really would want to leave that $299,000 difference on the table? No one.
Siegel also strongly advises reinvesting dividends, just like I do in my monthly income reports. Reinvesting dividends is the critical factor giving the edge to most winning stocks in the long run.
Siegel has stated that IPOs typically disappoint. In fact, he analyzed 9,000 IPOs between 1968 and 2003 and concluded that they consistently underperformed a small-cap index in nearly 4 out 5 cases. That’s a whopping 80%! Others disagree, especially with some of the hottest tech IPO’s that debuted between 2003 and present day.
If you were curious, Siegel has found the best performing stock from 1925 to 2003. Not many would have guessed it, but Phillip Morris, now known as Altria Group (NYSE: MO), dominated.
- Phillip Morris (NYSE: MO)
- Abbott Labs (NYSE: ABT)
- Bristol Myers Squibb (NYSE: BMY)
- Tootsie Rolls (NYSE: TR)
I’m sure no one would have expected Tootsie Rolls to be on that list, but chocolate candies were popular during this time!
The top 20 average is 15.26%, versus 10.85% for the S&P 500.
Average PE ratio of these companies is 19.04 versus S&P 500 PE ratio of 17.35.
Note that the average dividend yield is 3.40%, so they return cash to shareholders.
Siegel says if you look at every stock traded from 1925, the best performing stock is Phillip Morris. If you look at the best performing stock since 1950, it is Philip Morris. What is best stock since 1957? You guessed it – Philip Morris.
If you put $1,000 in the S&P 500 in 1957, it would be $124,522 by the end of 2004.
If you had put that same $1,000 in Philip Morris, it would be worth $4.6 million.
Philip Morris has even paid $125 billion to litigants for cigarette liability… And they still have outperformed the rest of the market.
History shows that, on average, just two stocks from the global market-cap top 10 list remain on the list a decade later. The two survivors almost always include the number-one stock.
But the number-one stock has never been top dog a decade later, ultimately underperforming and moving lower in the list. The second surviving stock has 50/50 odds of beating the market. If this history repeats, 9 of the top 10 market-cap stocks will underperform the market over the next 10 years, and just one has a 50% chance of underperforming.
Fundamental Analysis Summary
- Companies are worth the net present value of their cash flows
- Buy and hold companies priced below their intrinsic value
- Markets are 90% rational, 10% psychological
- Long-term investors
TECHNICAL ANALYSIS
Technical analysis uses visual patterns on a chart created by price to determine where the market is moving. For technical analysis, traders attempt to identify opportunities by looking at statistical trends, such as movements in a stock’s price and volume. Traders theorize there is no need to pay attention to the fundamentals since they are assumed to be factored into the price already. Technical analysts do not attempt to measure a security’s intrinsic value. Instead, they use stock charts to identify patterns and trends that suggest what a stock will do in the future.
1. RSI Indicator
Relative Strength Index (RSI): A momentum oscillator that is able to measure the velocity and magnitude of stock price changes.
The relative strength index (RSI) conveys a stock’s momentum, where RSI is calculated as the ratio of positive price changes to negative price changes.
RSI analysis compares the current RSI against different conditions.
- An RSI value of 70 indicates the stock is Overbought. Recommended Action: Hold or Sell.
- An RSI value of 50 indicates the stock is Neutral. Recommended Action: Hold.
- An RSI value of 30 indicates the stock is Oversold. Recommended Action: Buy.
When determining whether to buy a stock, you should go through many steps. Some steps are implicit, but all are necessary in the process.
When checking the RSI of a stock, ensure the indicator somewhere between 25 and 45 before pulling the trigger on the ‘Buy’ button.
2. MACD Indicator
Moving Average Convergence-Divergence (MACD): Difference between short-term and long-term exponential moving averages, as plotted against a center line that represents where the two averages equal each other.
The best-known volume indicator is the moving average convergence-divergence (MACD) indicator.
- A positive MACD value shows that the short-term average is above the long-term average and the market should move upward. Recommended Action: Hold or Sell.
- A negative MACD value shows that the short-term average is below the long-term average and that the market is moving downward. Recommended Action: Buy.
When the MACD is plotted on a chart, and its line crosses the centerline, it shows when the moving averages that make it up cross over.
The MACD indicator is the most popular tool in technical analysis because it gives traders the ability to quickly and easily identify the short-term trend direction. This helps traders to ensure that they are trading in the direction of momentum.
3. ADX Indicator
Average Directional Index (ADX): Uses positive and negative directional indicators to determine how strong an uptrend or downtrend is on a scale of 0 to 100.
- Values below 25 indicate a weak trend.
- Values over 25 indicate a strong trend.
The ADX indicator can be used to dictate if a security is trending or not. This deduction helps traders choose between a trend-following system or a non-trend-following system. The ADX indicator is an average of expanding price range values.
The Aroon indicator is a very similar tool to analyze trends. The ADX is composed of a total of 3 lines, while the Aroon indicator is composed of 2.
The Aroon indicator plots the lengths of time since the highest and lowest trading prices were reached, using that data to ascertain the nature and strength of the trend or the onset of a new trend.
Technical Analysis Summary
- Companies are worth what other investors perceive their as their worth
- Buy and sell companies based on movement in stock prices
- Markets are 10% rational, 90% psychological
- Traders
If you want to learn more about technical analysis, a great place to start is Technical Analysis for Dummies. Don’t be too offended by the title. The book really does a great job of taking a complex subject and educating using terms that an average investor can easily digest.
ARE STOCK ANALYSIS METHODS OUTDATED?
We can look at popular stock like Amazon.com, Inc. (NASDAQ: AMZN) and wonder “Is fundamental analysis broken?”

Here, we see the PE ratio of Amazon reached insane levels of near 500 in 2016. Yes, shareholders were paying more than 500 times the earnings…

Yet, when we look at the stock price graph above, the stock continued to soar despite overvaluation.
Some of the most popular tech stocks are from the FAAMG acronym, which stands for:
- Facebook (NASDAQ: FB)
- Amazon (NASDAQ: AMZN)
- Apple (NASDAQ: AAPL)
- Microsoft (NASDAQ: MSFT)
- Google (NASDAQ: GOOGL / NASDAQ: GOOG)
As of April 01, 2021, the market capitalization of these companies summed up to $848.14B + $1.58T + $2.06T + $1.82T + $1.44T = $7.75 trillion.
Each of the stocks in the FAAMG class is in the top 10, by market cap, of the S&P 500 index. Although the five stocks are only 1% of the 500 companies in the index, they make up 22% of the market value weighting in the S&P 500.
Since the S&P 500 has widely been accepted as representation of the US economy, a collective upward (or downward) movement in the stock performance of FAAMG will most likely lead to a similar movement in the index and the market.
Some experts are predicting another tech bubble and market crash like the one in 2000.
However, some analysts have noted that there is a major difference this time. Nowadays, there is plenty room for the current tech class to grow as areas of cloud computing, social media, e-commerce, artificial intelligence (AI), machine learning, and big data are still being explored and developed.
Only time will tell.
It feels like everyone is day trading or hitting the jackpot. Remind yourself to stay on your own investing course. Boring and slow often is the way to wealth.
USING FUNDAMENTAL AND TECHNICAL ANALYSIS TOGETHER
The Efficient Market Hypothesis argues that asset prices reflect all available information, so you cannot reliably use fundamental analysis (expert stock selection) or technical analysis (market timing) alone to outperform the overall market.

Should you buy what’s been working? Pour money into your losers? Pick new stocks altogether?
Yes, buying individual stocks offers the potential for greater gains but it also opens you up to all sorts of psychological pitfalls that don’t necessarily apply when owning the entire stock market.
The problem for many investors these days is they only believe in their stocks when they’re rising. If you don’t believe in those same stocks when they’re falling, you have no business owning them over the long haul.
You don’t have to meticulously study the stock market day in and day out like some hedge funds or financial analysts, but if you keep an occasional watchful eye, you will be able to tell when the stock market is hot or cooling off.
Buy low, sell high. You’re well aware of this trite advice, but it’s easier said than done. When you’re experiencing 30% – 50% drops of your entire net worth within months, and even in the short span of days, are you really going to have the discipline to refrain from panic selling?
FREE STOCK ANALYSIS TOOLS
One of the best free tools used to track the state of the market is the Fear and Greed Index.
- Use this to your advantage to buy when others are fearful.
- Hold (or sell) and enjoy watching your gains skyrocket when most investors are greedy.
Other free tools I frequently use to compare stocks include the following:
This is, by all means, not the most comprehensive method of buying stocks. However, I can guarantee you’ll have an edge over the average Joe.
One of the biggest reasons why I believe my portfolio has outperformed the S&P is pure luck because I never sell. I’ve never sold a stock.
And I don’t plan to until I actually need the money. You ask – when will that be, FLA?
Once I’ve left my corporate 9-5 job, I will live off the dividends of my stocks to financially support my ideal retirement.
WIN OR LOSE
Don’t forget that for every stock buy, there is someone on the other side of the deal that is selling their shares. That’s mainly where you see the buy / ask price. The broker is looking for a seller that agrees to the asking price.
The bid price refers to the highest price a buyer will pay for a security. The ask price refers to the lowest price a seller will accept for a security. The spread is the difference between these two prices. The smaller the spread, the greater the liquidity is of the given security.
For every stock transaction, there will be a winner and loser. Which side will you be on?
Disclosure: Fresh Life Advice is an opinion-based website. I am not a financial advisor, and the opinions on this site should not be considered financial advice.
Personal Capital: The Ultimate Tool to track your Net Worth, Budget and more.
What is your investing strategy? When do you know it’s the right time to buy or sell a stock? Let me know in the comments below.
Holy crap what a comprehensive post–this is pretty much everything a novice investor needs to know about investing all in one place. Excellent work! I've come out of the stonk frenzy by ultimately deciding that I am comfortable with more long term individual stock holdings, but for smaller allocations–like less than one percent of my net worth per individual stock. I'm currently in the 5-10% range of individual holdings and am probably most comfortable around there. Awesome stuff!
Thanks for reading IF! You've got exactly the right idea and are sticking to your portfolio allocation.
They is a very comprehensive article, Fresh Life Advice! I agree with your main points, especially the GME one. If I ever do speculate, I always make sure to keep it to a small percentage of my portfolio. I would say that I prefer individual stocks over index funds though, because I can pick the best performers from the index. If you view stocks as a business, you can be reasonably certain which stocks will out perform. You just have to find the best brands, highest margin businesses, and the companies that are growing revenues. The hard part is understanding how the industry will change. Overall, I think this is an excellent guide. Thanks for sharing.
I understand everyone has a different strategy and I completely respect that. The benefit of index funds is that you can reap the benefit of market returns. It's often very difficult to pick the best stock performers, especially in the long run because they are so many unpredictable factors. We are in total agreement that they hardest part is understanding the change in industry. Thank you so much for reading Graham!
What a great summary FLA! Thank you for taking the time to break this down. We are in the 1-5% range and comfortable there for now. Considering increasing in a few years but likely not to surpass 10%. My nerves can’t take much more than that. 😀
Thanks guys! I like that 1-5% allocation! Stick to it and continue on paying off that debt! You're doing great!
Very informative post! I like it.
I always love seeing those S&P graphs. It's almost like that comforting feeling of reaching in your pocket to make sure your wallet is still there. I've been dabbling in a bit of both as of late, but I'm an index fund guy and always will be. I just needed to have a nice sum in my funds before I had the courage to start picking stocks again.
Good stuff here FLA.
A+ analogy Noel! Those historical stock market graphs are so assuring knowing that your money will increase in the long run. Index funds will take you to the promise land – keep it up!
Your example of Tootsie Rolls caught me by surprise. I bought the stock of the other two ( BMY , ABT, etc.) a while ago, but Tootsie Rolls was never on my radar screen. Nice!
I was surprised as well. Great stock buys! Both BMY and ABT have great dividend yields.
SERIOUSLY comprehensive list of charts and explanations about how and why to invest. Nice write up. I wish I had the knowledge at your age that you do. You are YEARS ahead of your peers. "Boring and slow often is the way to wealth." Nailed it. It's not exciting but it works.
Wow, thank you so much – it means a lot, Kevin, especially with your wise experience!
Very well written, thank-you!
Hard to believe you've never a sold a stock…. wow. So when the technical analysis indicates overbought or expensive, you just hold?
And thank you! Precisely correct – buy and hold even when technical analysis indicates overbought. The more times you sell in a brokerage account, the more times you also have to pay tax for capital gains.
Great guide!! I remember reading something about a portfolio split evenly between all of the FANG companies actually outperformed the S&P 500 by a lot.. Which is just absolutely mind boggling. However, whichever strategy you choose, it's just a good idea to hold for the long term and see how the future will play out in the next 5 – 10 years.
Most investors are afraid that if it doesn't work out, then they just wasted the 5-10 years and start over from scratch. However, with a broad market index fund, there's little chance that it won't work out!
Thanks so much David! FAANG stocks have been on fire for the past 2 decades. The question is: how long can that last? And you're exactly right – the broad market index funds capture the market performance, which as we've seen, does quite well.
A wealth of information in one read! Although I own stocks in a few companies (no Phillip Morris), my comfort zone is really the index fund. I know some people thrive on market excitement but I'm okay with slow and steady. Thank you for sharing this comprehensive breakdown.
Thanks for visiting Ana! I completely support your investing strategy. You're doing things right. And the best part is, you don't have to religiously check stock prices with index funds!